The 25 Most Dangerous Cities for Drivers [+Car Theft Rates]
The average driver will experience a collision once every 10 years, but this number does depend on what state or city they live in. Factors that can increase a driver's chance of getting into an accident, especially a fatal one, include living in a rural area or frequently driving at nighttime or during the weekend. Multiple cities in the South, Midwest, and West are represented in our list of the most dangerous cities for drivers.
Read more


Find the Lowest Car Insurance Rates Today
Quote’s drivers have found rates as low as $42/month in the last few days!


Table of Contents
Table of Contents

Content Writer & Educator
Jessica Sautter is a Content Writer for CarInsuranceCompanies.com with a Bachelor’s Degree from Eastern Michigan University in Elementary Education with a Major in Reading and a Minor in Mathematics.
Jessica Sautter

Licensed Insurance Agent & Agency Owner
Tracey L. Wells is a licensed insurance agent and Farmers insurance agency owner with 23 years of experience. He is proud to be a local Farmers agent serving Grayson, Georgia and surrounding areas. With experience as both an underwriter and agent, he provides his customers with insight that others agents may not have. His agency offers all lines of insurance including home, life, auto, RV, busi...
Tracey L. Wells
Updated November 2024
Driving is a way of life for most Americans. Data from the U.S. Census Bureau shows that there are more than 120 million vehicles used for commuting, and research has found that 83% of adults drive at least several times per week. Even though driving is one of the most popular modes of transportation, it’s not without risk.

This article covers the 25 most dangerous cities for drivers in the United States.
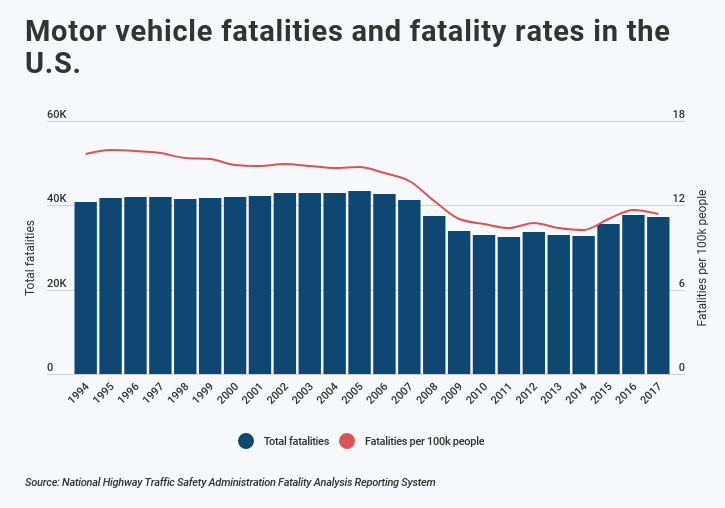
Research from the National Highway Traffic Safety Administration (NHTSA) shows that in 2017, driving was responsible for 37,133 fatalities. Adjusted for population, that’s 11.4 driving fatalities for every 100,000 people in the U.S.
Driving has long been a leading cause of death among teens—young drivers have less experience and are more likely to engage in risky driving behavior. There has been a slight rise in traffic fatalities over the past five years, but the longer-term trend shows that fewer people are dying as a result of car accidents.
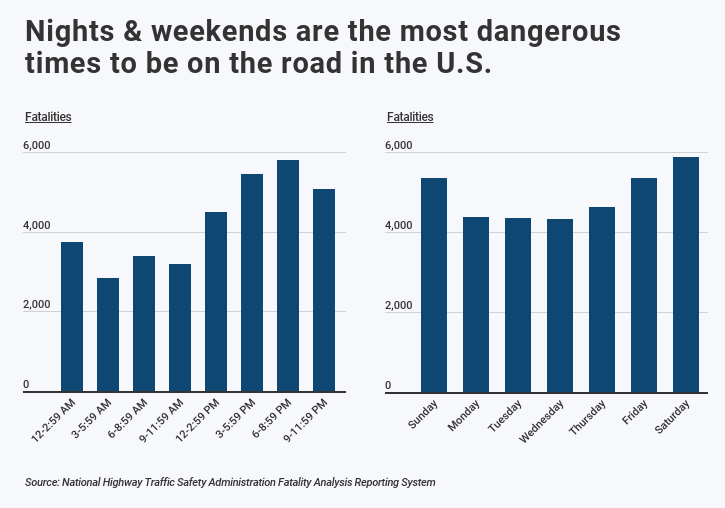
Despite safety improvements over the past 25 years, certain times of the day and week are still more dangerous than others for drivers. Car accidents can occur at any time, but data from the NHTSA shows that fatal accidents are more likely to occur on nights and weekends. In 2017, there were 70% more fatal accidents between 6-9 PM than between 6-9 AM. Likewise, compared to Monday-Thursday, Friday-Sunday saw 25% more fatal crashes per day.
Timing is not the only factor that influences traffic fatalities; location matters too. The likelihood of getting into any car accident is higher in urban areas, but the likelihood of being involved in a fatal accident is higher in rural areas. According to sources, only 19% of Americans live in rural areas and 30% of the miles traveled by vehicles occur in rural areas, but almost half of the traffic fatalities happen in these locations. Within rural areas, crash deaths are also more likely to occur on local and collector roads rather than on interstates.
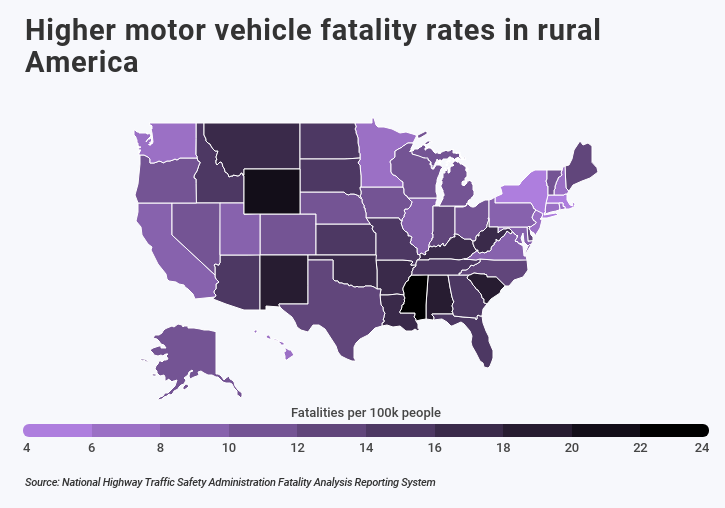
As an example, rural collector roads and local roads may not be fully paved or have clearly delineated directions of travel, increasing the likelihood of a collision. In addition, the speed limit on rural roads is usually higher than on urban roads, and crashes that occur at higher speeds can be more severe. These factors are compounded by limited (or delayed) access to health care services in many rural areas.
TRENDING
Can car insurance companies backdate premiums? Most providers will backdate coverage and premiums when requested. However, in order to get backdated car insurance, companies usually require a “no known loss” letter.
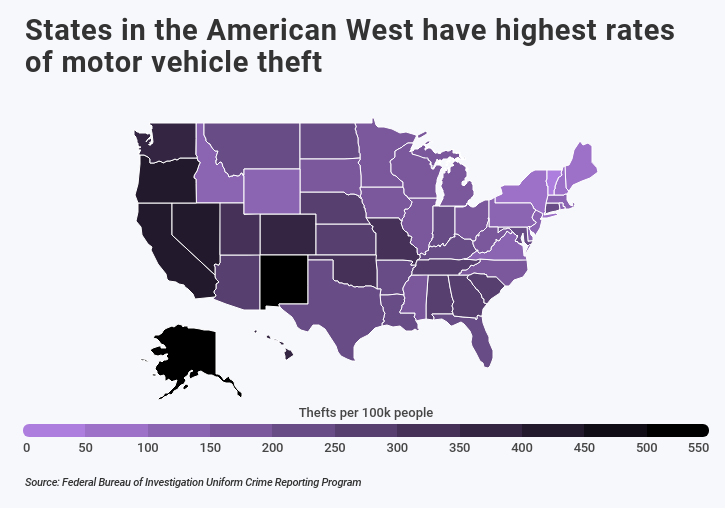
Collisions aren’t the only danger for drivers. Cars are also subject to theft—a crime that cost Americans about $6 billion in 2017. The good news is that vehicle thefts have also been trending down over the past two decades. In 2017, the number of vehicle thefts nationwide was about a third lower than what it was in 1998 and the rate of vehicle thefts per 100,000 people was nearly halved.
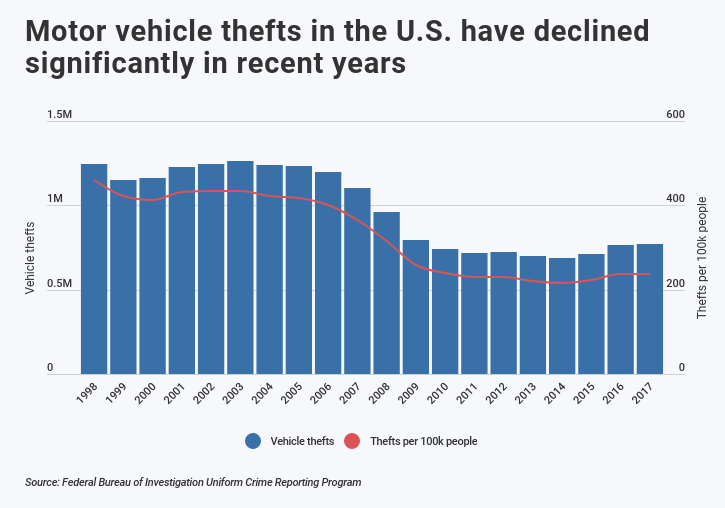
Similar to motor vehicle accidents and fatalities, location is a big determinant in the likelihood of having a car stolen. Most car thefts occur in Western states, such as New Mexico, Nevada, and California. By contrast, states in the Northeast, such as Vermont, Maine, and New York, tend to have lower rates of motor vehicle theft.
When considering the likelihood of a collision, traffic fatalities, motor vehicle thefts, and inclement weather, some cities are more dangerous for drivers than others.
To identify the most dangerous cities for drivers, researchers at CarInsuranceCompanies.com used data from the National Highway Traffic Safety Administration Fatality Analysis Reporting System, Allstate’s America’s Best Drivers Report, the Federal Bureau of Investigation Uniform Crime Reporting Program, and the National Centers for Environmental Information Comparative Climatic Data to create a composite score for each of the largest U.S. cities based on the following factors:
- Motor vehicle fatality rate (50%)
- Relative collision likelihood (30%)
- Motor vehicle theft rate (10%)
- Annual days with precipitation (10%)
Only the 183 most populous cities in the U.S. with available data from all of the sources were included. We also did not look at the most dangerous cities to drive in the world, just the worst cities to drive in the USA. Before we get into the key findings of the study, we know that some of you are wondering how these factors impact car insurance. After all, car insurance can be confusing, even to the most experienced driver.
For that reason, we put together a Car Insurance 101 page where we cover the basics of car insurance from different types to how to save money. Then there are some of you who are already jumping to get a car insurance quote.
For those who are ready to find cheaper rates even if they live in one of the most dangerous driving states or cities, just plug your ZIP code into our FREE online quote comparison tool above. It’ll give the best rates for you based on your demographic information and location.
Finally, in addition to covering the most dangerous cities for drivers in the United States, we’ll touch on the best cities for drivers, the safest cities to drive in, the most dangerous driving states, and the best driving cities in America, all in the frequently asked questions section.
Now, back to the study. Here’s what we found in our survey of national traffic and accident data:
Key Takeaways
- Nationwide there were 37,133 fatalities in 2017, resulting in a fatality rate of 11.4 per 100,000 people. Among major cities, that number ranges from a low of 0.6 in Cary, NC to a high of 27.9 in Charleston, SC.
- Across the entire U.S., the average driver experiences a collision once every 10.6 years. That ranges from a high of 14.9 in Brownsville, TX to a low of 4.2 in Baltimore, MD.
- According to data from the FBI, there were over 770,000 reported motor vehicle thefts in 2017, or 237 per 100,000 people. The car theft rate ranges from 31.6 in Naperville, IL to over 1,375 in Albuquerque, NM.
- Several cities in the South, Midwest, and California are among the most dangerous 25 cities for drivers. More specifically, four cities from the list are from California, four are from Florida, and four are from Texas.
Free Insurance Comparison
Compare Quotes From Top Companies and Save
The most dangerous cities for drivers
#25 – Orlando, FL
- Motor vehicle fatalities: 13.2 per 100k people (37 per year)
- Relative collision likelihood: 15.3% above average
- Motor vehicle thefts: 495 per 100k people (1,387 per year)
- Annual days with precipitation: 117
- Population: 280,258
#24 – Fresno, CA
- Motor vehicle fatalities: 11.6 per 100k people (61 per year)
- Relative collision likelihood: 31.9% above average
- Motor vehicle thefts: 529 per 100k people (2,789 per year)
- Annual days with precipitation: 45
- Population: 527,422
Free Insurance Comparison
Compare Quotes From Top Companies and Save
#23 – Portland, OR
- Motor vehicle fatalities: 7.4 per 100k people (48 per year)
- Relative collision likelihood: 51.0% above average
- Motor vehicle thefts: 1,126 per 100k people (7,295 per year)
- Annual days with precipitation: 153
- Population: 648,121
RELATED
Regardless of your vehicle, we can help you find the right car insurance policy. Our analysts have put together everything you need to know about specific insurance policies like car insurance for postal employees or car insurance for rarely driven cars.
#22 – San Bernardino, CA
- Motor vehicle fatalities: 10.1 per 100k people (22 per year)
- Relative collision likelihood: 41.8% above average
- Motor vehicle thefts: 1,049 per 100k people (2,277 per year)
- Annual days with precipitation: 38
- Population: 216,983
#21 – Fort Worth, TX
- Motor vehicle fatalities: 12.6 per 100k people (110 per year)
- Relative collision likelihood: 29.7% above average
- Motor vehicle thefts: 309 per 100k people (2,706 per year)
- Annual days with precipitation: 79
- Population: 876,060
Free Insurance Comparison
Compare Quotes From Top Companies and Save
#20 – Cincinnati, OH
- Motor vehicle fatalities: 8.6 per 100k people (26 per year)
- Relative collision likelihood: 47.6% above average
- Motor vehicle thefts: 493 per 100k people (1,485 per year)
- Annual days with precipitation: 132
- Population: 301,305
#19 – Houston, TX
- Motor vehicle fatalities: 10.6 per 100k people (245 per year)
- Relative collision likelihood: 38.0% above average
- Motor vehicle thefts: 501 per 100k people (11,596 per year)
- Annual days with precipitation: 103
- Population: 2,313,230
#18 – Pomona, CA
- Motor vehicle fatalities: 11.8 per 100k people (18 per year)
- Relative collision likelihood: 34.0% above average
- Motor vehicle thefts: 817 per 100k people (1,250 per year)
- Annual days with precipitation: 27
- Population: 152,946
Free Insurance Comparison
Compare Quotes From Top Companies and Save
#17 – Hollywood, FL
- Motor vehicle fatalities: 14.3 per 100k people (22 per year)
- Relative collision likelihood: 14.9% above average
- Motor vehicle thefts: 329 per 100k people (505 per year)
- Annual days with precipitation: 145
- Population: 153,625
#16 – Mesquite, TX
- Motor vehicle fatalities: 11.1 per 100k people (16 per year)
- Relative collision likelihood: 38.4% above average
- Motor vehicle thefts: 590 per 100k people (849 per year)
- Annual days with precipitation: 79
- Population: 143,822
#15 – Hialeah, FL
- Motor vehicle fatalities: 12.5 per 100k people (30 per year)
- Relative collision likelihood: 26.0% above average
- Motor vehicle thefts: 286 per 100k people (685 per year)
- Annual days with precipitation: 138
- Population: 239,682
DID YOU KNOW?
Age is one of the strongest predictors of car insurance premiums. For example, the average price for teen car insurance is much higher than the national average. The cost of car insurance for 22-year-olds is also particularly high.
Free Insurance Comparison
Compare Quotes From Top Companies and Save
#14 – Fort Lauderdale, FL
- Motor vehicle fatalities: 16.7 per 100k people (30 per year)
- Relative collision likelihood: 6.8% above average
- Motor vehicle thefts: 514 per 100k people (925 per year)
- Annual days with precipitation: 145
- Population: 180,071
#13 – Charlotte, NC
- Motor vehicle fatalities: 12.0 per 100k people (103 per year)
- Relative collision likelihood: 35.9% above average
- Motor vehicle thefts: 305 per 100k people (2,622 per year)
- Annual days with precipitation: 112
- Population: 859,052
#12 – Memphis, TN
- Motor vehicle fatalities: 15.2 per 100k people (99 per year)
- Relative collision likelihood: 16.8% above average
- Motor vehicle thefts: 614 per 100k people (4,002 per year)
- Annual days with precipitation: 108
- Population: 652,231
Free Insurance Comparison
Compare Quotes From Top Companies and Save
#11 – Springfield, MA
- Motor vehicle fatalities: 11.0 per 100k people (17 per year)
- Relative collision likelihood: 81.7% above average
- Motor vehicle thefts: 329 per 100k people (509 per year)
- Annual days with precipitation: 100
- Population: 154,763
#10 – Louisville, KY
- Motor vehicle fatalities: 14.3 per 100k people (89 per year)
- Relative collision likelihood: 16.2% above average
- Motor vehicle thefts: 622 per 100k people (3,864 per year)
- Annual days with precipitation: 124
- Population: 621,337
#9 – Sacramento, CA
- Motor vehicle fatalities: 13.7 per 100k people (69 per year)
- Relative collision likelihood: 40.0% above average
- Motor vehicle thefts: 542 per 100k people (2,718 per year)
- Annual days with precipitation: 57
- Population: 501,890
Free Insurance Comparison
Compare Quotes From Top Companies and Save
#8 – Cleveland, OH
- Motor vehicle fatalities: 13.7 per 100k people (53 per year)
- Relative collision likelihood: 18.9% above average
- Motor vehicle thefts: 881 per 100k people (3,395 per year)
- Annual days with precipitation: 156
- Population: 385,552
#7 – New Orleans, LA
- Motor vehicle fatalities: 11.2 per 100k people (44 per year)
- Relative collision likelihood: 49.1% above average
- Motor vehicle thefts: 644 per 100k people (2,531 per year)
- Annual days with precipitation: 114
- Population: 393,292
#6 – Atlanta, GA
- Motor vehicle fatalities: 11.3 per 100k people (55 per year)
- Relative collision likelihood: 49.4% above average
- Motor vehicle thefts: 678 per 100k people (3,297 per year)
- Annual days with precipitation: 115
- Population: 486,299
Free Insurance Comparison
Compare Quotes From Top Companies and Save
#5 – St. Louis, MO
- Motor vehicle fatalities: 18.1 per 100k people (56 per year)
- Relative collision likelihood: 22.4% above average
- Motor vehicle thefts: 879 per 100k people (2,713 per year)
- Annual days with precipitation: 110
- Population: 308,626
#4 – Detroit, MI
- Motor vehicle fatalities: 15.3 per 100k people (103 per year)
- Relative collision likelihood: 22.8% above average
- Motor vehicle thefts: 1,212 per 100k people (8,155 per year)
- Annual days with precipitation: 135
- Population: 673,103
#3 – Dallas, TX
- Motor vehicle fatalities: 14.5 per 100k people (194 per year)
- Relative collision likelihood: 46.5% above average
- Motor vehicle thefts: 590 per 100k people (7,913 per year)
- Annual days with precipitation: 79
- Population: 1,341,103
Free Insurance Comparison
Compare Quotes From Top Companies and Save
#2 – Savannah, GA
- Motor vehicle fatalities: 15.7 per 100k people (23 per year)
- Relative collision likelihood: 37.8% above average
- Motor vehicle thefts: 642 per 100k people (940 per year)
- Annual days with precipitation: 110
- Population: 146,449
#1 – Baton Rouge, LA
- Motor vehicle fatalities: 23.1 per 100k people (52 per year)
- Relative collision likelihood: 55.1% above average
- Motor vehicle thefts: 440 per 100k people (991 per year)
- Annual days with precipitation: 113
- Population: 225,370
Complete Study Results: All 183 Cities Compared
| Rank | City | Traffic Fatality Rate | Annual Traffic Fatalities | Collision Likelihood | Vehicle Theft Rate | Annual Vehicle Thefts | Days with Precipitation |
|---|---|---|---|---|---|---|---|
| 1 | Baton Rouge, LA | 23.1 | 52 | +55.1% | 440 | 991 | 113 |
| 2 | Savannah, GA | 15.7 | 23 | +37.8% | 642 | 940 | 110 |
| 3 | Dallas, TX | 14.5 | 194 | +46.5% | 590 | 7,913 | 79 |
| 4 | Detroit, MI | 15.3 | 103 | +22.8% | 1,212 | 8,155 | 135 |
| 5 | St. Louis, MO | 18.1 | 56 | +22.4% | 879 | 2,713 | 110 |
| 6 | Atlanta, GA | 11.3 | 55 | +49.4% | 678 | 3,297 | 115 |
| 7 | New Orleans, LA | 11.2 | 44 | +49.1% | 644 | 2,531 | 114 |
| 8 | Cleveland, OH | 13.7 | 53 | +18.9% | 881 | 3,395 | 156 |
| 9 | Sacramento, CA | 13.7 | 69 | +40.0% | 542 | 2,718 | 57 |
| 10 | Louisville, KY | 14.3 | 89 | +16.2% | 622 | 3,864 | 124 |
| 11 | Springfield, MA | 11 | 17 | +81.7% | 329 | 509 | 100 |
| 12 | Memphis, TN | 15.2 | 99 | +16.8% | 614 | 4,002 | 108 |
| 13 | Charlotte, NC | 12 | 103 | +35.9% | 305 | 2,622 | 112 |
| 14 | Fort Lauderdale, FL | 16.7 | 30 | +6.8% | 514 | 925 | 145 |
| 15 | Hialeah, FL | 12.5 | 30 | +26.0% | 286 | 685 | 138 |
| 16 | Mesquite, TX | 11.1 | 16 | +38.4% | 590 | 849 | 79 |
| 17 | Hollywood, FL | 14.3 | 22 | +14.9% | 329 | 505 | 145 |
| 18 | Pomona, CA | 11.8 | 18 | +34.0% | 817 | 1,250 | 27 |
| 19 | Houston, TX | 10.6 | 245 | +38.0% | 501 | 11,596 | 103 |
| 20 | Cincinnati, OH | 8.6 | 26 | +47.6% | 493 | 1,485 | 132 |
| 21 | Fort Worth, TX | 12.6 | 110 | +29.7% | 309 | 2,706 | 79 |
| 22 | San Bernardino, CA | 10.1 | 22 | +41.8% | 1,049 | 2,277 | 38 |
| 23 | Portland, OR | 7.4 | 48 | +51.0% | 1,126 | 7,295 | 153 |
| 24 | Fresno, CA | 11.6 | 61 | +31.9% | 529 | 2,789 | 45 |
| 25 | Orlando, FL | 13.2 | 37 | +15.3% | 495 | 1,387 | 117 |
| 26 | Newark, NJ | 9.1 | 26 | +32.0% | 839 | 2,392 | 122 |
| 27 | Greensboro, NC | 16.2 | 47 | +11.9% | 292 | 846 | 111 |
| 28 | Garden Grove, CA | 10.3 | 18 | +53.7% | 377 | 657 | 36 |
| 29 | Jackson, MS | 16.1 | 27 | +8.7% | 447 | 747 | 109 |
| 30 | Charleston, SC | 27.9 | 39 | +12.6% | 217 | 303 | 107 |
| 31 | Jacksonville, FL | 16.3 | 145 | +8.4% | 328 | 2,925 | 114 |
| 32 | Mobile, AL | 16.8 | 32 | -8.40% | 662 | 1,259 | 120 |
| 33 | Salem, OR | 10.6 | 18 | +17.3% | 507 | 861 | 144 |
| 34 | Albuquerque, NM | 15 | 84 | +5.3% | 1,376 | 7,684 | 59 |
| 35 | Phoenix, AZ | 15.3 | 249 | +13.6% | 471 | 7,653 | 35 |
| 36 | Anaheim, CA | 9.6 | 34 | +48.8% | 440 | 1,552 | 33 |
| 37 | Milwaukee, WI | 11.8 | 70 | +6.7% | 924 | 5,503 | 125 |
| 38 | Knoxville, TN | 15.5 | 29 | -8.30% | 553 | 1,036 | 127 |
| 39 | Bridgeport, CT | 7.5 | 11 | +52.8% | 488 | 716 | 120 |
| 40 | Bakersfield, CA | 13.7 | 52 | +12.9% | 729 | 2,777 | 37 |
| 41 | Tampa, FL | 13.5 | 52 | +17.2% | 147 | 567 | 107 |
| 42 | Little Rock, AR | 10.6 | 21 | +19.9% | 569 | 1,130 | 104 |
| 43 | Indianapolis, IN | 11.2 | 96 | +11.0% | 572 | 4,904 | 127 |
| 44 | San Antonio, TX | 9.7 | 146 | +29.0% | 454 | 6,864 | 81 |
| 45 | Shreveport, LA | 12.5 | 24 | +11.6% | 461 | 884 | 99 |
| 46 | Nashville, TN | 10.2 | 68 | +19.4% | 385 | 2,565 | 120 |
| 47 | Garland, TX | 8 | 19 | +48.4% | 341 | 810 | 79 |
| 48 | Oklahoma City, OK | 14.9 | 96 | +0.6% | 435 | 2,800 | 82 |
| 49 | Stockton, CA | 9.3 | 29 | +27.4% | 660 | 2,049 | 55 |
| 50 | Dayton, OH | 11.4 | 16 | +5.6% | 439 | 616 | 134 |
| 51 | Fontana, CA | 9.4 | 20 | +31.4% | 416 | 881 | 38 |
| 52 | Fort Wayne, IN | 14.1 | 36 | -2.30% | 209 | 532 | 132 |
| 53 | Oakland, CA | 6.6 | 28 | +67.6% | 1,292 | 5,495 | 66 |
| 54 | Waco, TX | 13.9 | 19 | +12.1% | 140 | 191 | 79 |
| 55 | Tulsa, OK | 11.7 | 47 | +3.0% | 860 | 3,460 | 91 |
| 56 | Austin, TX | 8.4 | 80 | +39.1% | 219 | 2,079 | 84 |
| 57 | Torrance, CA | 8.2 | 12 | +49.5% | 297 | 436 | 35 |
| 58 | Columbus, GA | 12.4 | 24 | +3.1% | 363 | 704 | 109 |
| 59 | Grand Rapids, MI | 8 | 16 | +27.4% | 183 | 363 | 146 |
| 60 | Baltimore, MD | 5.4 | 33 | +152.4% | 845 | 5,171 | 116 |
| 61 | Tacoma, WA | 6.1 | 13 | +33.9% | 977 | 2,086 | 149 |
| 62 | Hayward, CA | 6.2 | 10 | +54.4% | 1,122 | 1,801 | 65 |
| 63 | Salt Lake City, UT | 10 | 20 | +7.8% | 940 | 1,886 | 92 |
| 64 | Santa Ana, CA | 7.2 | 24 | +47.7% | 593 | 1,980 | 36 |
| 65 | Oceanside, CA | 11.4 | 20 | +15.9% | 281 | 496 | 33 |
| 66 | Tempe, AZ | 13.5 | 25 | +6.9% | 256 | 473 | 37 |
| 67 | Columbus, OH | 6.6 | 58 | +31.7% | 474 | 4,176 | 138 |
| 68 | Philadelphia, PA | 5.9 | 94 | +66.9% | 347 | 5,483 | 118 |
| 69 | Killeen, TX | 11.7 | 17 | +3.9% | 389 | 566 | 73 |
| 70 | Buffalo, NY | 6.6 | 17 | +33.7% | 322 | 833 | 167 |
| 71 | Norfolk, VA | 7.8 | 19 | +25.5% | 293 | 718 | 117 |
| 72 | Riverside, CA | 7.9 | 26 | +28.2% | 528 | 1,730 | 30 |
| 73 | Fayetteville, NC | 11.9 | 25 | -0.50% | 198 | 415 | 111 |
| 74 | Los Angeles, CA | 6.4 | 257 | +81.9% | 480 | 19,193 | 35 |
| 75 | Amarillo, TX | 13 | 26 | -8.00% | 494 | 990 | 70 |
| 76 | Tucson, AZ | 11.9 | 64 | -1.70% | 449 | 2,407 | 51 |
| 77 | Lexington, KY | 10.9 | 35 | -3.90% | 395 | 1,273 | 133 |
| 78 | Providence, RI | 5.5 | 10 | +70.8% | 322 | 580 | 125 |
| 79 | Glendale, AZ | 9.7 | 24 | +14.7% | 471 | 1,163 | 30 |
| 80 | Chattanooga, TN | 9.5 | 17 | -3.40% | 749 | 1,342 | 120 |
| 81 | St. Petersburg, FL | 10.6 | 28 | +2.8% | 372 | 978 | 97 |
| 82 | Rochester, NY | 7.2 | 15 | +22.8% | 296 | 616 | 162 |
| 83 | Grand Prairie, TX | 7.7 | 15 | +32.4% | 255 | 495 | 70 |
| 84 | Springfield, MO | 10.2 | 17 | -7.70% | 1,176 | 1,969 | 109 |
| 85 | Miami, FL | 9.1 | 42 | +4.5% | 396 | 1,835 | 133 |
| 86 | Paterson, NJ | 6.1 | 9 | +33.3% | 424 | 631 | 123 |
| 87 | Lancaster, CA | 9.4 | 15 | +16.2% | 405 | 650 | 29 |
| 88 | Spokane, WA | 7.4 | 16 | +14.4% | 800 | 1,737 | 112 |
| 89 | Arlington, TX | 6.8 | 27 | +39.9% | 343 | 1,360 | 70 |
| 90 | Moreno Valley, CA | 7.7 | 16 | +25.8% | 559 | 1,158 | 30 |
| 91 | Palmdale, CA | 8.9 | 14 | +23.7% | 276 | 435 | 27 |
| 92 | Toledo, OH | 8.3 | 23 | +10.6% | 269 | 745 | 134 |
| 93 | Newport News, VA | 8.9 | 16 | +12.1% | 272 | 488 | 109 |
| 94 | Las Vegas, NV | 7 | 45 | +26.7% | 1,276 | 8,186 | 26 |
| 95 | Syracuse, NY | 7.7 | 11 | +13.9% | 259 | 371 | 172 |
| 96 | Fremont, CA | 6.4 | 15 | +41.2% | 368 | 865 | 65 |
| 97 | Washington, DC | 4.5 | 31 | +142.2% | 367 | 2,545 | 114 |
| 98 | Modesto, CA | 6.1 | 13 | +34.2% | 659 | 1,412 | 56 |
| 99 | Pittsburgh, PA | 5.3 | 16 | +41.9% | 225 | 680 | 154 |
| 100 | Plano, TX | 7 | 20 | +37.2% | 119 | 339 | 81 |
| 101 | Worcester, MA | 4.3 | 8 | +105.5% | 214 | 397 | 134 |
| 102 | Vancouver, WA | 5.7 | 10 | +22.2% | 605 | 1,063 | 168 |
| 103 | Long Beach, CA | 5.8 | 27 | +45.4% | 581 | 2,729 | 34 |
| 104 | Pembroke Pines, FL | 7.6 | 13 | +16.6% | 182 | 310 | 122 |
| 105 | San Jose, CA | 4.3 | 45 | +44.6% | 779 | 8,068 | 108 |
| 106 | Wichita, KS | 9.5 | 37 | -6.60% | 634 | 2,478 | 86 |
| 107 | Corpus Christi, TX | 11.4 | 37 | -8.40% | 225 | 731 | 76 |
| 108 | Huntsville, AL | 9.7 | 19 | -21.10% | 535 | 1,046 | 116 |
| 109 | Aurora, CO | 7.1 | 26 | +15.0% | 596 | 2,189 | 87 |
| 110 | Omaha, NE | 8.1 | 38 | -3.00% | 750 | 3,500 | 100 |
| 111 | Escondido, CA | 7.2 | 11 | +25.6% | 262 | 398 | 42 |
| 112 | Chicago, IL | 5.4 | 147 | +28.0% | 426 | 11,578 | 126 |
| 113 | Seattle, WA | 4.1 | 30 | +37.4% | 501 | 3,630 | 156 |
| 114 | Denver, CO | 7 | 49 | +13.5% | 789 | 5,560 | 87 |
| 115 | Durham, NC | 7.8 | 21 | +10.5% | 284 | 762 | 105 |
| 116 | Irving, TX | 5 | 12 | +50.7% | 296 | 711 | 79 |
| 117 | Boston, MA | 3.8 | 26 | +116.4% | 176 | 1,205 | 127 |
| 118 | Clarksville, TN | 7.8 | 12 | +1.2% | 157 | 241 | 128 |
| 119 | Reno, NV | 8.4 | 21 | -6.10% | 575 | 1,432 | 51 |
| 120 | Akron, OH | 7.1 | 14 | -0.10% | 382 | 755 | 156 |
| 121 | Thornton, CO | 8 | 11 | -3.90% | 539 | 739 | 72 |
| 122 | Miramar, FL | 5.7 | 8 | +18.3% | 185 | 260 | 145 |
| 123 | Colorado Springs, CO | 8.4 | 39 | -12.00% | 460 | 2,135 | 89 |
| 124 | Pasadena, CA | 4.2 | 6 | +54.6% | 252 | 359 | 43 |
| 125 | Minneapolis, MN | 4 | 17 | +28.9% | 565 | 2,388 | 115 |
| 126 | San Francisco, CA | 2.8 | 25 | +55.5% | 547 | 4,834 | 67 |
| 127 | St. Paul, MN | 3.9 | 12 | +28.9% | 680 | 2,084 | 110 |
| 128 | Fullerton, CA | 4.3 | 6 | +53.2% | 275 | 386 | 33 |
| 129 | Sunnyvale, CA | 4.6 | 7 | +44.3% | 194 | 298 | 64 |
| 130 | Honolulu, HI | 4.9 | 17 | +15.6% | 1,029 | 3,606 | 93 |
| 131 | Orange, CA | 6.4 | 9 | +19.6% | 243 | 341 | 36 |
| 132 | Alexandria, VA | 2.5 | 4 | +69.8% | 171 | 273 | 114 |
| 133 | Chesapeake, VA | 7.5 | 18 | +1.1% | 104 | 250 | 117 |
| 134 | North Las Vegas, NV | 4.1 | 10 | +39.2% | 544 | 1,321 | 22 |
| 135 | Boise, ID | 9.3 | 21 | -22.60% | 153 | 346 | 90 |
| 136 | Rancho Cucamonga, CA | 6.8 | 12 | +17.8% | 207 | 368 | 27 |
| 137 | Corona, CA | 4.8 | 8 | +32.4% | 333 | 559 | 30 |
| 138 | Glendale, CA | 3.4 | 7 | +98.9% | 156 | 317 | 43 |
| 139 | San Diego, CA | 5.2 | 74 | +24.6% | 362 | 5,135 | 41 |
| 140 | Salinas, CA | 5.1 | 8 | +14.4% | 788 | 1,242 | 57 |
| 141 | Tallahassee, FL | 6.3 | 12 | -0.50% | 389 | 744 | 114 |
| 142 | Jersey City, NJ | 5.2 | 14 | +19.7% | 181 | 491 | 107 |
| 143 | Montgomery, AL | 7 | 14 | -7.50% | 423 | 844 | 107 |
| 144 | Irvine, CA | 4.3 | 12 | +40.3% | 70 | 194 | 34 |
| 145 | Des Moines, IA | 6 | 13 | -1.90% | 579 | 1,260 | 108 |
| 146 | Ontario, CA | 4 | 7 | +32.9% | 518 | 911 | 27 |
| 147 | El Paso, TX | 7.3 | 50 | +1.8% | 117 | 800 | 48 |
| 148 | Fort Collins, CO | 7.9 | 13 | -16.10% | 125 | 207 | 87 |
| 149 | Lakewood, CO | 5.8 | 9 | -1.80% | 770 | 1,193 | 78 |
| 150 | Cape Coral, FL | 7.6 | 14 | -13.60% | 93 | 170 | 111 |
| 151 | Mesa, AZ | 7.9 | 39 | -8.90% | 178 | 884 | 35 |
| 152 | Santa Rosa, CA | 5.1 | 9 | +14.9% | 234 | 411 | 81 |
| 153 | Bellevue, WA | 1.4 | 2 | +27.9% | 214 | 309 | 157 |
| 154 | Virginia Beach, VA | 5.6 | 25 | +7.5% | 102 | 459 | 117 |
| 155 | Anchorage, AK | 4.8 | 14 | -5.40% | 1,055 | 3,104 | 115 |
| 156 | Santa Clarita, CA | 4.7 | 10 | +25.1% | 194 | 410 | 29 |
| 157 | Pasadena, TX | 4.6 | 7 | +14.0% | 247 | 379 | 88 |
| 158 | Rockford, IL | 5.4 | 8 | -3.10% | 303 | 450 | 118 |
| 159 | Frisco, TX | 3.4 | 6 | +28.5% | 47 | 84 | 82 |
| 160 | Yonkers, NY | 1.5 | 3 | +26.1% | 90 | 182 | 126 |
| 161 | Chula Vista, CA | 4.1 | 11 | +18.3% | 281 | 761 | 32 |
| 162 | Port St. Lucie, FL | 5.8 | 11 | -10.70% | 46 | 87 | 142 |
| 163 | New York, NY | 2.4 | 207 | +19.8% | 67 | 5,735 | 120 |
| 164 | Sioux Falls, SD | 4 | 7 | +10.1% | 265 | 469 | 97 |
| 165 | McKinney, TX | 2.2 | 4 | +26.2% | 85 | 155 | 75 |
| 166 | Laredo, TX | 6.9 | 18 | -18.80% | 65 | 170 | 61 |
| 167 | Brownsville, TX | 6.5 | 12 | -29.30% | 77 | 141 | 72 |
| 168 | Elk Grove, CA | 2.9 | 5 | +18.1% | 123 | 211 | 60 |
| 169 | Eugene, OR | 3 | 5 | -2.60% | 323 | 545 | 140 |
| 170 | Huntington Beach, CA | 3 | 6 | +16.2% | 191 | 385 | 35 |
| 171 | Scottsdale, AZ | 6 | 15 | -9.10% | 98 | 246 | 30 |
| 172 | Joliet, IL | 2 | 3 | +7.3% | 112 | 165 | 121 |
| 173 | McAllen, TX | 5.6 | 8 | -14.90% | 32 | 46 | 48 |
| 174 | Naperville, IL | 2 | 3 | +8.5% | 32 | 47 | 114 |
| 175 | Aurora, IL | 2 | 4 | +5.9% | 87 | 176 | 116 |
| 176 | Henderson, NV | 3.3 | 10 | +7.8% | 212 | 641 | 27 |
| 177 | Madison, WI | 3.5 | 9 | -13.20% | 169 | 432 | 121 |
| 178 | Peoria, AZ | 4.2 | 7 | -2.50% | 141 | 237 | 34 |
| 179 | Overland Park, KS | 4.2 | 8 | -15.00% | 143 | 274 | 66 |
| 180 | Chandler, AZ | 3.9 | 10 | -5.70% | 147 | 372 | 28 |
| 181 | Gilbert, AZ | 3.3 | 8 | -1.60% | 56 | 135 | 30 |
| 182 | Cary, NC | 0.6 | 1 | -12.10% | 43 | 72 | 113 |
| 183 | Olathe, KS | 2.2 | 3 | -16.50% | 111 | 152 | 98 |
*the traffic fatality and vehicle theft rates are for every 100,000 state residents
Free Insurance Comparison
Compare Quotes From Top Companies and Save
Frequently Asked Questions: Dangerous cities for driving & living
Now that we’ve covered the 25 most dangerous cities for drivers, let’s answer a few of your frequently asked questions. They include:
- What is the most dangerous city to drive in?
- What city has the most traffic fatalities?
- What state has the most car crashes?
Let’s get started.
#1 – What is the most dangerous city to drive in?
According to our study, which took into account collision probability, vehicle thefts, and motor vehicle fatalities, Baton Rouge is the most dangerous city to drive in. Compared to the average U.S. city, you are 55% more likely to get into an accident and there are 52 fatal crashes on average per year.
#2 – What state has the most dangerous drivers?
From other studies we have seen, there are two states that frequently have the most dangerous drivers: South Carolina and New Mexico. These two states struggle with pretty much every driving category, including careless driving, drunk driving, and speeding. The death rate for people who drive in those states is much higher compared to the average states in the U.S.
Free Insurance Comparison
Compare Quotes From Top Companies and Save
#3 – What are the 10 most dangerous cities to live in?
According to homicides and other criminal activity, a few cities stand out year after year on lists of the 10 most dangerous cities to live in: Chicago, Baltimore, St. Louis, Memphis, and others.
#4 – What city has the most traffic fatalities?
Baton Rouge, as we’ve covered, has the highest fatality rate with 23.1 traffic deaths per 100,000 people every year. While this amounts to a lower overall traffic death count than in other cities (LA would beat it soundly in this metric, for instance), the rate or per capita measure shows how dangerous the area is for an individual driver.
#5 – What is the safest country to drive in?
Norway, Sweden, and Germany are often considered the safest countries to drive in even though, as in the case of Germany, there may be more flexible guidelines as far as speed. Germans seeking their driver’s licenses also undergo more significant education and training compared to U.S. drivers.
Free Insurance Comparison
Compare Quotes From Top Companies and Save
#6 – What city has the best drivers?
Brownsville, Texas, Boise, Idaho, and other small towns or cities are often featured on lists of the cities with the best drivers. The drivers in these cities have a small number of hard-braking incidents and longer times between filing insurance claims.
#7 – What state has the most car crashes?
Generally, the states with the highest populations have the highest number of car crashes: California, Texas, and Florida. That’s not necessarily indicative of the quality of driving, however. Those states generally don’t crack the top 10 in worst drivers per state lists, unlike South Carolina, New Mexico, and other states.
#8 – Which state has the best drivers?
In 2020, Massachusetts came out on top as the state with the best drivers. Although it is great in every category from drinking and driving to speeding, it consistently has one of the lowest death rates throughout the country. This means that when you drive through or in Massachusetts, you are in the safest driving environment by state that you can get.
Methodology: Determining The 25 Deadliest Cities for Drivers
To identify the most dangerous cities for drivers, a composite score was calculated based on the following factors:
- Motor vehicle fatality rate (50%)
- Relative collision likelihood (30%)
- Motor vehicle theft rate (10%)
- Annual days with precipitation (10%)
Using data from:
- Annual motor vehicle fatalities are from the National Highway Traffic Safety Administration Fatality Analysis Reporting System (NHTSA)
- Collision insurance rates are from Allstate’s America’s Best Drivers Report
- Annual motor vehicle thefts are from the Federal Bureau of Investigation Uniform Crime Reporting Program (FBI)
- Annual days with precipitation are from the National Centers for Environmental Information Comparative Climatic Data (NCDC NOAA)
- Census data is from the United States Census Bureau (census.gov)
Only the 200 most populous cities in the U.S. were included in the analysis. Of those 200 cities, 17 were removed because of missing data across one or multiple data sources.
Now that you know the 25 most dangerous cities for drivers in America, are you ready to compare rates? Living in one of the most dangerous cities for drivers can cause your car insurance rates to rise, even if you aren’t involved in criminal activity or been a victim of car theft or a break-in.
Fortunately, our online quote generator gives you the best car insurance rates from car insurance companies in your area, even if you live in one of the most dangerous cities for drivers. Just put your ZIP code into the box below to find the best car insurance quotes for you.
Related Articles


Get a FREE Quote in Minutes
Insurance rates change constantly — we help you stay ahead by making it easy to compare top options and save.